
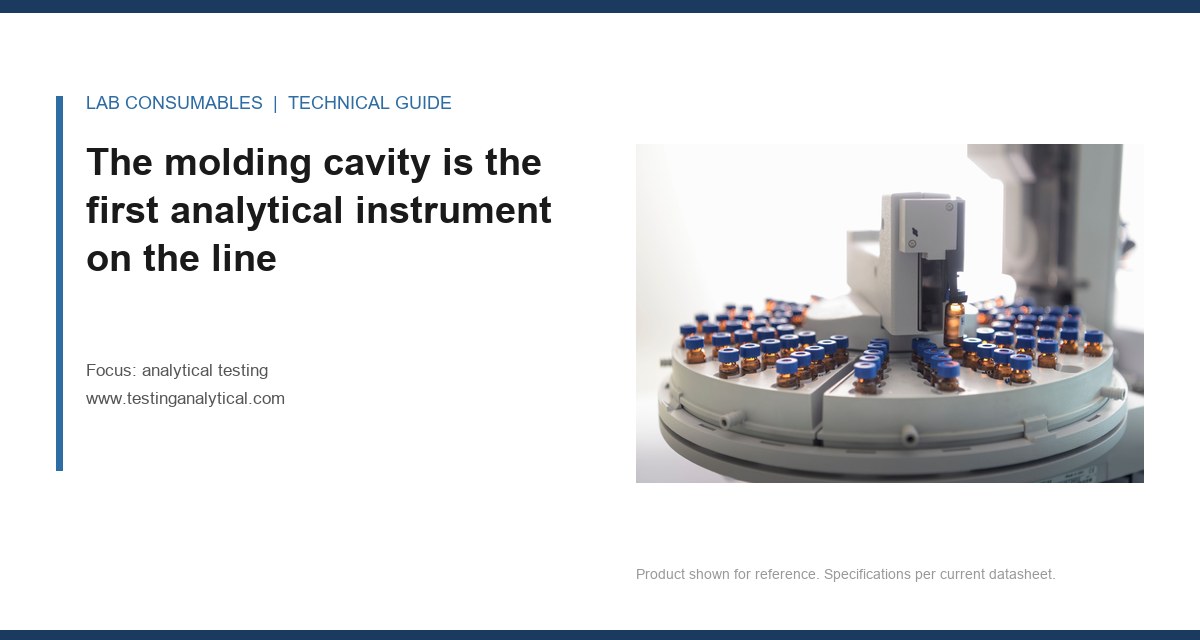
A 2 mL HPLC vial run drifted out of spec at station 4 last Tuesday. The septum puncture force hit 6.8 N against a 5.5 N upper limit, and the line stopped itself before a single bad tray reached the cleanroom exit. That stop is the difference between a factory that builds analytical testing consumables and one that hopes its inspection table catches what the process already lost. When someone asks how analytical testing is manufactured and what the factory controls, the honest answer is that most of it happens before the final QC bench ever sees a part. The line itself is the control system.
I have watched injection molding operators treat a vial mold like a metal stamping die. That is the first mistake. A 12 mm crimp-top vial for HPLC has a neck ID tolerance of 0.15 mm and a thread or crimp profile that must hold a seal under 0.8 bar of internal pressure without leaking. The mold does not just shape polymer. It sets crystallinity, residual stress, and dimensional memory that decide whether that vial survives a 60 °C headspace incubation or a -80 °C freezer pull without cracking.
What the factory actually controls at the molding station is narrower than most buyers assume. Three parameters are closed-loop controlled on any serious line: melt temperature, injection pressure, and hold pressure. Melt temperature for polypropylene vials runs 220 to 240 °C depending on the grade. Injection pressure sits between 800 and 1,200 bar for multi-cavity tools. Hold pressure is tuned to pack the cavity without overpacking the gate, because overpacked gates leave a cold slug that breaks off into the sample later. Those three parameters are adjusted by the machine in real time from thermocouple and pressure transducer feedback.
Everything else at molding is open-loop or checked at the end. Cavity-to-cavity fill balance is not closed-loop on most lines. I have measured a 4% weight variation between cavity 3 and cavity 7 on a 32-cavity tool before anyone flagged it, because the operator only checked the first and last cavity. That variation becomes a 0.04 mL fill volume difference at the 1.5 mL mark, which is enough to fail a 2% RSD peak area requirement on a sensitive method. The fix was a hot runner balance adjustment and a shift to weighing all 32 cavities once per hour, not once per shift.
Mold temperature control matters more than most procurement managers realize. A mold running at 25 °C produces a different surface finish and a different seal lip profile than the same mold at 45 °C. For PTFE-lined silicone septa, the overmolding step has its own thermal window. PTFE film bonds to silicone at 160 to 180 °C. Below that, the film delaminates during the first needle puncture. Above that, the PTFE begins to degrade and release fluorinated volatiles that show up as ghost peaks in GC runs. This is why a chromatography consumables supplier that cannot tell you its molding thermal profile is not a supplier you should qualify.
Septum punching is a force measurement problem, not a cutting problem
The septum line is where I have seen the most silent failures. A septum looks simple. It is a disk of PTFE on top of a silicone core. But the way that disk is punched from a laminated sheet determines whether an autosampler needle bends on injection 1 or injection 90. The factory controls punch force, punch speed, and die clearance at this station. Those three are closed-loop on modern lines with servo-driven punches.
Punch force for a standard 9 mm septum runs 4.0 to 5.5 N at the die. Below 4.0 N, the cut is incomplete and the septum edge has a feathered lip that sheds particles into the sample. Above 5.5 N, the silicone compresses too much during cutting and the septum takes a permanent set, which reduces reseal performance. I have measured a drop from 4.8 to 3.1 N on a worn die over a single shift. The operator did not notice because the septa looked fine under room light. The customer noticed when their headspace vials lost pressure after two injections.
Die clearance is the parameter nobody asks about. For a 9 mm septum, the punch-to-die clearance should be 0.02 to 0.04 mm. Tighter than 0.02 mm and the punch galls against the die, producing metal fines. Looser than 0.04 mm and the PTFE layer smears instead of shearing, leaving a ragged edge that catches the needle. I specify a punch count limit of 250,000 cycles per die before resharpening, not because the die fails catastrophically at 250,001, but because the force curve starts to drift measurably after that point. A factory that does not track punch count is flying blind on septum quality.
Post-punch washing is another control point. Septa are washed to remove silicone oligomers and PTFE fines. The wash water conductivity is a closed-loop parameter on good lines, held below 2 µS/cm. The wash temperature is held at 60 to 70 °C with a 30-minute residence time. If the factory skips the wash or shortens the soak, the septa pass a visual check and fail a GC-MS blank run. I have traced a recurring siloxane peak at m/z 207 to a septum wash tank that was being drained every third shift instead of every shift. The fix was a conductivity alarm set at 5 µS/cm that stopped the line automatically.
Cap and crimp geometry is where torque becomes chemistry
The cap station is the least glamorous part of the line and the one most likely to produce a slow, intermittent failure in the field. A 9 mm screw cap for HPLC vials has a thread pitch of 1.5 mm and a thread engagement of 2.5 turns. The cap must seal against the vial lip with a compression set that stays stable from -20 °C to 80 °C. The factory controls cap molding dimensions, liner placement, and closure torque at this station.
Closure torque for 9 mm screw caps is 0.18 to 0.22 N·m on an automated capping head. Below 0.18 N·m, the seal is marginal and solvent evaporation occurs over a 24-hour run. Above 0.22 N·m, the cap skirt can crack or the liner can extrude into the vial mouth. I have seen a line running at 0.28 N·m because a maintenance tech “tightened it up to be safe.” The result was a 6% field failure rate on cap skirts and a recall. The torque transducer on that capping head was out of calibration by 0.06 N·m, and nobody had checked it in nine months.
Crimp caps are worse. A 11 mm aluminum crimp cap for headspace vials must be crimped to a seal force that produces a 0.4 to 0.6 mm deformation of the aluminum skirt. That deformation is measured with a dial indicator on a crimp gauge, not with a torque wrench. The factory controls crimp head pressure and crimp jaw geometry. Jaw wear is the common failure. A worn jaw produces an oval crimp that seals on one side and leaks on the other. I have measured a 0.3 mm difference in skirt deformation around the circumference of a single cap from a worn jaw. That vial leaked at 90 °C headspace temperature and the entire 40-vial tray was rejected.
Liner placement is an end-of-line check on most lines, and that is a problem. A liner that is 0.2 mm off-center in a 9 mm cap will not seat evenly against the vial lip. The factory should be using a vision system that checks liner concentricity to within 0.1 mm at the capping station, not a manual check at the end. I have seen a run of 10,000 caps with a 3% off-center liner rate that passed final inspection because the inspector was checking cap color and thread form, not liner position. The customer found the problem when their autosampler needle hit the edge of the liner and bent.
Insert and vial interior geometry is a dimensional stack problem
Micro-insert vials for limited sample volumes are where the dimensional stack really bites. A 250 µL glass insert for a 2 mL vial has an outer diameter tolerance of 0.05 mm and a length tolerance of 0.3 mm. The insert must sit in the vial without rocking and without trapping air bubbles under the cone. The factory controls insert OD, insert length, and the interior cone angle of the vial bottom at this station.
The interior cone angle is the parameter that is checked at the end on most lines, and that is not good enough. A 2 mL vial with a 9 mm opening has an interior bottom cone angle of 25 to 30 degrees. If that angle drifts to 20 degrees because of mold wear, the insert sits higher in the vial and the needle reaches the bottom of the insert before the full sample volume is drawn. I have measured a 0.4 mm height difference in insert seating between two cavities of the same vial mold. That 0.4 mm is the difference between drawing 200 µL and drawing 180 µL from a nominal 250 µL insert.
Glass insert manufacturing has its own control points. The insert is drawn from borosilicate glass tubing with a wall thickness of 0.5 mm. The drawing temperature is 700 to 800 °C, and the draw speed controls the wall thickness. A 10% variation in draw speed produces a 0.05 mm wall thickness variation, which changes the insert ID enough to affect the dead volume. The factory should be checking insert ID with a go/no-go gauge at the drawing station, not with a caliper at final inspection.
The dimensional stack for a vial, cap, and septum is the real reason fit and alignment failures read as analytical failures. A 9 mm vial with a neck OD of 8.75 mm, a cap with an ID of 9.05 mm, and a septum with an OD of 9.10 mm has a total stack clearance of 0.30 mm. That is enough to seal. But if the vial neck OD drifts to 8.85 mm and the cap ID drifts to 9.00 mm, the stack clearance drops to 0.15 mm. The septum compresses unevenly and the seal fails under repeated injection. This is why a lab vials buyer should ask for the full dimensional stack drawing, not just the individual part tolerances.
Washing and depyrogenation are the stations that decide blank quality
Vial washing is not a cleaning step. It is a contamination control step. The factory controls wash water quality, rinse volume, and drying temperature at this station. For HPLC vials, the wash must remove mold release agents, glass fines, and airborne particulates. For GC vials, it must also remove any residual hydrocarbons that would show up as baseline noise.
Wash water for HPLC vials is typically USP purified water with a conductivity below 1.3 µS/cm and a total organic carbon (TOC) below 500 ppb. The rinse volume is 3 to 5 times the vial internal volume, and the drying temperature is 60 to 80 °C with a 20-minute dwell. If the drying temperature is too low, residual water dilutes the sample. If it is too high, the vial develops a static charge that attracts particulates.
Depyrogenation for endotoxin-sensitive applications is a separate step. Dry heat depyrogenation runs at 250 °C for 30 minutes, which achieves a 3-log reduction in endotoxin. Some factories run at 180 °C for 2 hours, which achieves a similar reduction but with more thermal stress on the vial. The factory controls the oven temperature profile and the belt speed through the oven. A 5 °C drop in oven temperature from 250 °C to 245 °C without a corresponding increase in dwell time is enough to fail a USP <85> bacterial endotoxin test.
I have seen a depyrogenation oven with a cold spot in the middle of the belt that was 12 °C below the setpoint. The factory did not know because the temperature probe was at the oven exit. The vials in the cold spot were only reaching 238 °C, which is not enough for a 3-log reduction. The fix was a multi-point temperature mapping study and a belt speed reduction from 0.8 to 0.6 m/min. That is the kind of control that separates a factory that understands analytical testing from one that just runs parts through an oven.
Closed-loop vs. end-of-line: what the line actually controls
Here is the honest map of a well-run analytical consumables line. The closed-loop parameters are the ones with a sensor, a setpoint, and an automatic correction. The end-of-line checks are the ones where a human or a camera looks at the finished part and makes a pass/fail decision. The difference matters because a closed-loop parameter can be held within a narrow band, while an end-of-line check only catches the parts that are already out of spec.
| Station | Closed-loop controlled | End-of-line checked | Typical control band |
|---|---|---|---|
| Vial molding | Melt temp, injection pressure, hold pressure | Cavity weight balance, crystallinity | ±2 °C, ±50 bar, ±0.5% weight |
| Septum punching | Punch force, punch speed | Die clearance wear, edge quality | 4.0-5.5 N, 0.02-0.04 mm clearance |
| Cap molding | Melt temp, mold temp | Thread form, liner position | ±2 °C, ±0.1 mm liner concentricity |
| Capping/crimping | Closure torque, crimp pressure | Skirt deformation, seal integrity | 0.18-0.22 N·m, 0.4-0.6 mm crimp |
| Insert drawing | Draw temperature, draw speed | Insert ID, insert length | ±10 °C, ±0.05 mm wall thickness |
| Washing | Water conductivity, rinse volume | Residual TOC, particulate count | <1.3 µS/cm, <500 ppb TOC |
| Depyrogenation | Oven temperature, belt speed | Endotoxin level, vial stress cracks | 250 °C ±2 °C, 30 min dwell |
The pattern is clear. The factory controls the physical parameters that determine dimensional and material properties in real time. It checks the derived properties, like seal integrity and endotoxin level, at the end. A factory that tries to control everything at the end is running a sorting operation, not a manufacturing process. A factory that controls the right parameters in real time can hold a 1.5% RSD on a 100-vial lot without sorting a single part.
For a buyer, the question is not “do you inspect your vials?” The question is “which parameters do you control in real time, and which do you only check at the end?” The answer tells you whether the factory understands the physics of the part or just the spec sheet. A HPLC vial supplier that can show you the closed-loop control chart for punch force is a supplier that will not ship you a tray of septa that fail on injection 3.
Two field cases that show the difference
Case one: a pharmaceutical QC lab reported intermittent baseline noise on their GC system. The noise appeared only on certain vials from a 10,000-vial lot. The vials passed visual inspection and a water blank test. I measured the residual hydrocarbon level on 20 vials from the lot using thermal desorption GC-MS. Eight vials showed a toluene peak at 2 to 5 ppb. The other 12 showed less than 0.5 ppb. The difference traced back to the wash station. The wash water TOC had drifted to 900 ppb for a 4-hour window when the carbon filter was saturated. The factory’s TOC alarm was set at 1,000 ppb, so the drift was never flagged. The fix was a TOC alarm set at 500 ppb and a filter change schedule based on water volume, not calendar days.
Case two: an environmental lab running EPA SW-846 method 8260 for volatiles reported a 4% RSD on their internal standard across a 40-vial sequence. The method requires less than 15% RSD, so the run was technically in spec, but the lab’s historical RSD was 1.5%. I measured the septum puncture force on 10 septa from the same lot. The force ranged from 3.2 to 5.8 N, with a mean of 4.6 N. The wide range meant the autosampler needle was experiencing variable resistance, which changed the injection volume slightly. The factory’s punch force control band was 4.0 to 5.5 N, but the die was worn and the force was drifting. The fix was a die change at 250,000 cycles and a tighter control band of 4.3 to 5.2 N. The RSD dropped back to 1.6% on the next sequence.
Both cases are the same story. The failure was not in the final inspection. The failure was in a parameter that should have been closed-loop controlled but was only checked at the end, or not checked at all. The U.S. EPA SW-846 test methods assume a stable sample container. When the container is not stable, the method cannot fix it.
The decision rule for qualifying a factory
When I qualify a factory for analytical testing consumables, I ask for three things. First, the closed-loop control chart for the station that produces the highest-risk parameter for my application. If I am buying headspace vials, that is the crimp station. If I am buying septa, that is the punch station. Second, the dimensional stack drawing for the full assembly, not just the individual parts. Third, the punch count or die change log, because that tells me whether the factory is managing tool wear or waiting for tool failure.
A factory that cannot produce these three documents is not a factory I will qualify, regardless of the price. The cost of a failed run in an analytical lab is not the cost of the vial. It is the cost of the analyst’s time, the instrument time, the re-run, and the audit finding if the failure is not caught. A 10-cent vial that fails on injection 3 of a 90-injection sequence costs the lab more than a 50-cent vial that performs consistently.
The line control question is the only question that matters. Ask it first. Get the control charts. Check the die change log. If the factory cannot show you the closed-loop parameters, assume the parts are sorted, not manufactured. That assumption will save you more than any specification sheet ever will. For more on how these controls translate into method performance, see the analytical testing resources across our network, and compare against Agilent chromatography consumables and columns, Thermo Fisher chromatography and sample handling, and Restek technical resources for chromatography to see what the best-in-class suppliers publish about their own control limits.
References & further reading
Related resources from our lab consumables network:
- Analytical Testing at testinganalytical.com
- Hplc Vial at vialforhplc.com
- Chromatography Consumables at chromatographyconsumables.com
- Lab Vials at labvials.com
External references and standards: